Product
Product Update: Introducing Gantt Charts 🎉
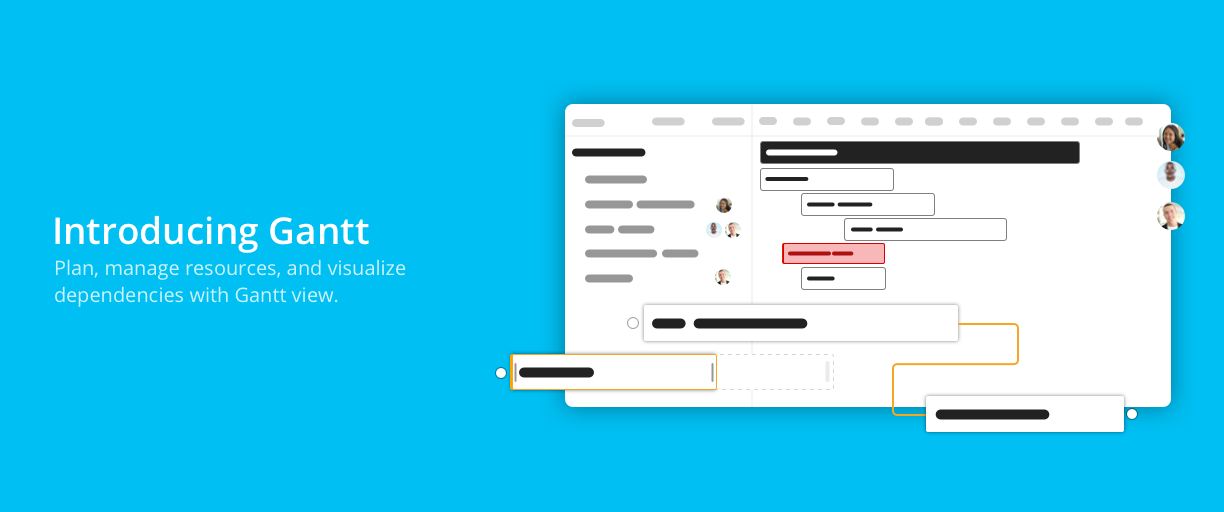
You’ve been asking and we’re delivering. Yes — you can now create Gantt charts in Rindle.

For those who are new to Gantt charts, a Gantt chart is "a type of bar chart that illustrates a project schedule," according to Wikipedia.
Gantt charts are also an excellent way to gain project visibility.
Have you ever been working on a project with many team members and stakeholders, and you really wished you had a way to show them the bird’s eye view of a project?
That’s exactly what “Gantt” does.
If you feel like you’re sneezing every time you say Gantt, no worries — we feel like we’re sneezing too. “Gantt” is actually the last name of the person who invented it!
It’s a powerful way to communicate progress of a project while also showing the timelines and dependencies the project has.
Let’s dig in to what this powerful feature can do and how to put it to work for your teams.
How Gantt charts can help
Project planning and real-time flexibility
There’s something magical that happens when you build a Gantt chart. Because Gantt operates on a timeline, you’ll be able to see your project unfold before you across days, weeks, and even months.

Gantt also has an effect on the project planner from a psychological perspective: it actually forces you to take an honest, realistic approach to your project plan.
Do the dates line up with your deadline? Are some parts of the project longer than others? Do some tasks seem to have too little or too much time allocated to them? Is the timeline aggressive or is it flexible?
But the best part about Gantt charts in Rindle? You can make live, real-time edits — right then and there.
All you have to do is click and drag the task in the Gantt chart view and drag it to wherever you want. The start and due dates will update auto-magically.
High-level project overviews
Gantt charts also give you another added benefit: you can see your project from a bird’s eye view.
If you’ve ever struggled with making sense of tons of tasks and subtasks and visually seeing how the project will shake out over time, a Gantt chart will give you that immediate high-level visibility.
Plus, while most project management tools give you some sort of calendar to see when tasks are due, Gantt will show how that task stretches over time — with a start date and an end date.
Project visibility and transparency
This is actually a perfect segue into another way to leverage Gantt charts.
With every project comes a team and a few stakeholders, and some of those stakeholders could be executives, advisors, and leaders from other departments.
They might not need the complete, detailed plan, but an overview of the project would be immensely helpful for communicating the project’s progress
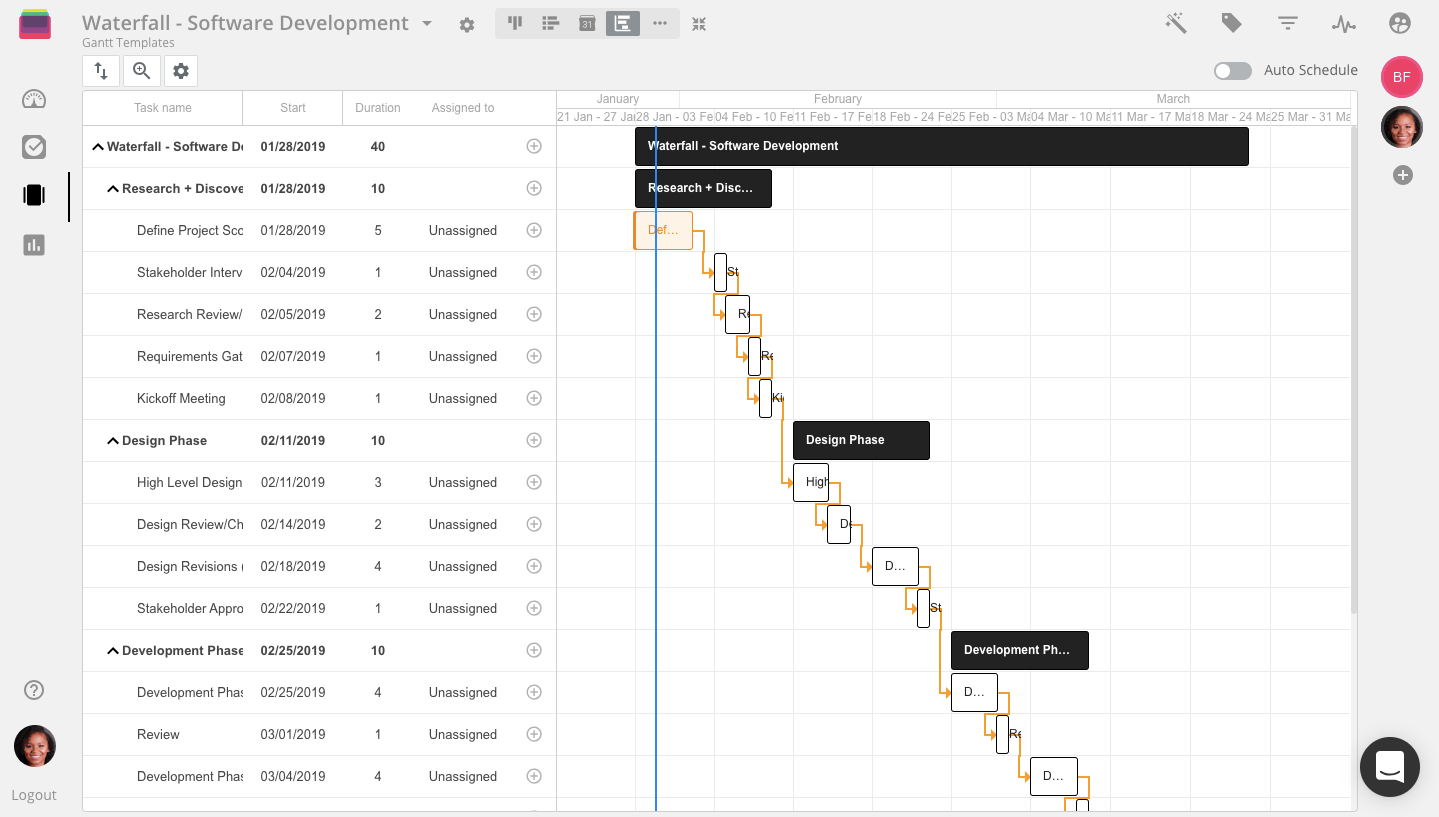
Manage task dependencies
When building a Gantt chart for the first time, you’ll immediately notice that you begin to set start dates and due dates for each task that some tasks physically can’t happen until another task is completed first.
We call these “task dependencies” — one task depends on the task before it to be completed. Otherwise, the ask after it can’t technically start.

If you click the Gantt chart view in any board in Rindle, you’ll immediately be able to see how your tasks lay out over time. You’ll also be able to assign task dependencies, and you’ll be able to reorganize them and re-prioritize them in a more logical order if something doesn’t add up in your plan.
Reviewing these Gantt charts as a team is also extremely valuable since team members and task owners will be able to tell you if a task depends on another.
Ways to use Gantt Charts
Gantt for Marketing Campaigns
This is perhaps one of the most underutilized use cases for Gantt! Yes, even marketers can take advantage of Gantt.
Running campaigns and showing the department’s progress over time will become a breeze with Gantt. You’ll also be able to show your stakeholders, executives, investors, and fellow team leaders what your team will be working on in the coming weeks.
And to get even more specific, you can use Gantt to show how a campaign will roll out. Highlight everything from the copywriting process, to building landing pages to running any paid media or kicking off your emails.
Show the moving parts of the campaign and any major deadlines or due dates.
Gantt for Launching a Website

If you’ve ever planned and launched a website, you already know the deep complexities, moving milestones, and blindsiding changes that come with it.
This is where Gantt shines. It excels at communicating the task dependencies involved in designing, building, and launching a website, and can easily show any stakeholder the progress of the project.
Gantt can show you the teams and activities involved in planning for the website launch (including copywriting, UX design, branding, building, coding, and implementing).
It can also go deeper into each phase of the website launch — digging deep into the sets of pages that need to be written and built, the technical requirements to implement these pages, and other back-end needs regarding redirects from the previous website.
Depending on the size of the website project, the Gantt chart can be extremely detailed or fairly trimmed down. It completely depends on your needs as a project owner, but just know that if you need to see the project over time, Gantt will be your best friend.
Gantt for Quarterly Planning
Similar to the first example, you can use Gantt to plan out your department’s entire quarter.
It doesn’t matter if you’re in engineering, product, HR, marketing, sales, research and development, customer support, design, customer success, finance, etc. — you can leverage Gantt to plan out the major projects that are aligned with your strategic initiatives.
You can use Gantt on an individual or team level or both! Show your own personal plan for the next 3 months, or if you’re a team leader, show the department’s plan.
What projects will you tackle? What conferences and events will you attend? What deliverables do you expect to produce? Any and all of these can be covered in your Gantt chart.
Creating Gantt charts in Rindle
Ready to get started with Gantt charts in Rindle? All you have to do is sign-up for a free trial right here.